 Hari Jimenez · Oct 27, 2026 · 4 min read
What Is a Bell Curve? Explained With Five Years of My Whoop HRV
"All models are wrong, but some are useful." - George Box
In my Z-scores post I said the bell curve is what tells you whether a number is normal or an anomaly. Then I used Z-scores in both of my Whoop projects without ever showing you a bell curve built from my own data. So this time I went back to five years of Whoop data and asked a simpler question: what does a bell curve actually look like, and how do you read one?
I used my heart rate variability (HRV): the variation in time between heartbeats while I sleep, measured in milliseconds (ms). Higher is generally better, and it's the biggest input into my Whoop recovery score. It's also the best-behaved metric in my data, which makes it a great teacher.
Quick note: I'm not a health professional. This is one person's data, and Whoop scores aren't a diagnosis.
What a bell curve is
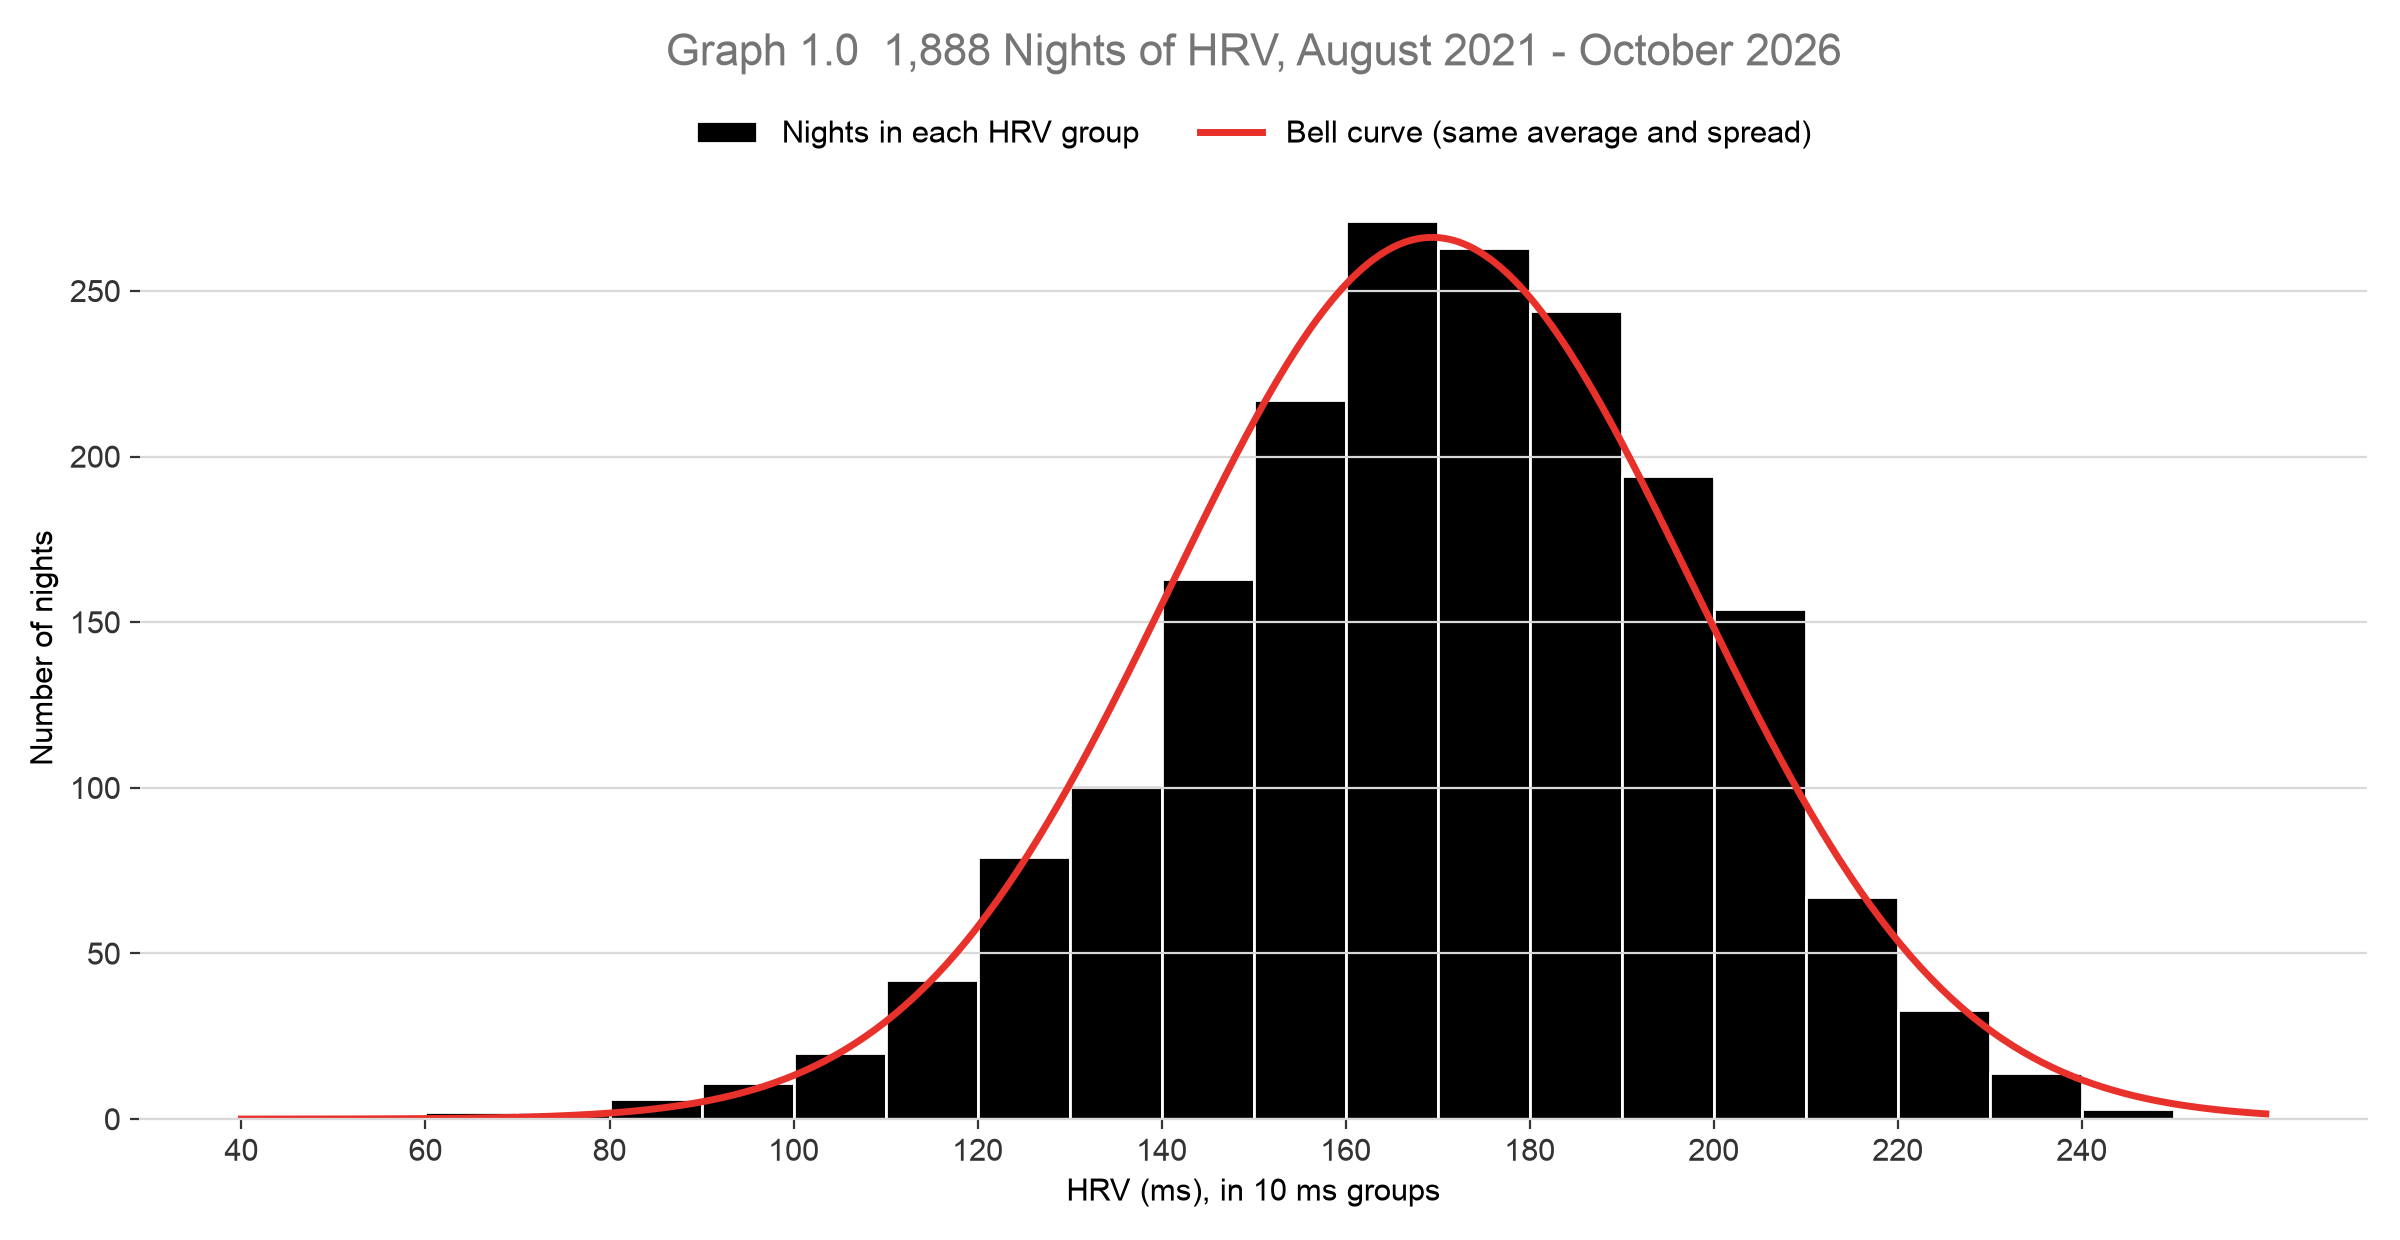
I took 1,888 nights of HRV (August 2021 to October 2026), sorted them into 10 ms groups and counted how many nights fell into each group. That's the black bars in Graph 1.0. The red line is a perfect bell curve with the same average and spread as my data.
That's the whole idea of a bell curve:
- Most values cluster in the middle. 28% of my nights landed between 160 and 180 ms.
- The further you go from the middle, the rarer it gets. Only 2% of my nights came in under 110 ms, and under 1% over 230 ms.
- Both sides roughly mirror each other. The left side of the hill looks a lot like the right side.
Why does HRV do this? Because no single thing decides it. Sleep, training, stress, alcohol, travel, a late dinner: each one nudges it a little up or down. When lots of small, independent nudges add up, they tend to cancel out around the middle, and only rarely do they all push in the same direction. That's what creates the shape.
The two numbers that describe it
You can describe any bell curve with just two numbers:
| Number | What it tells you | My HRV |
|---|---|---|
| Average | Where the middle of the hill is | 169 ms |
| Standard deviation (SD) | How wide the hill is, or how far a typical night sits from the average | 28 ms |
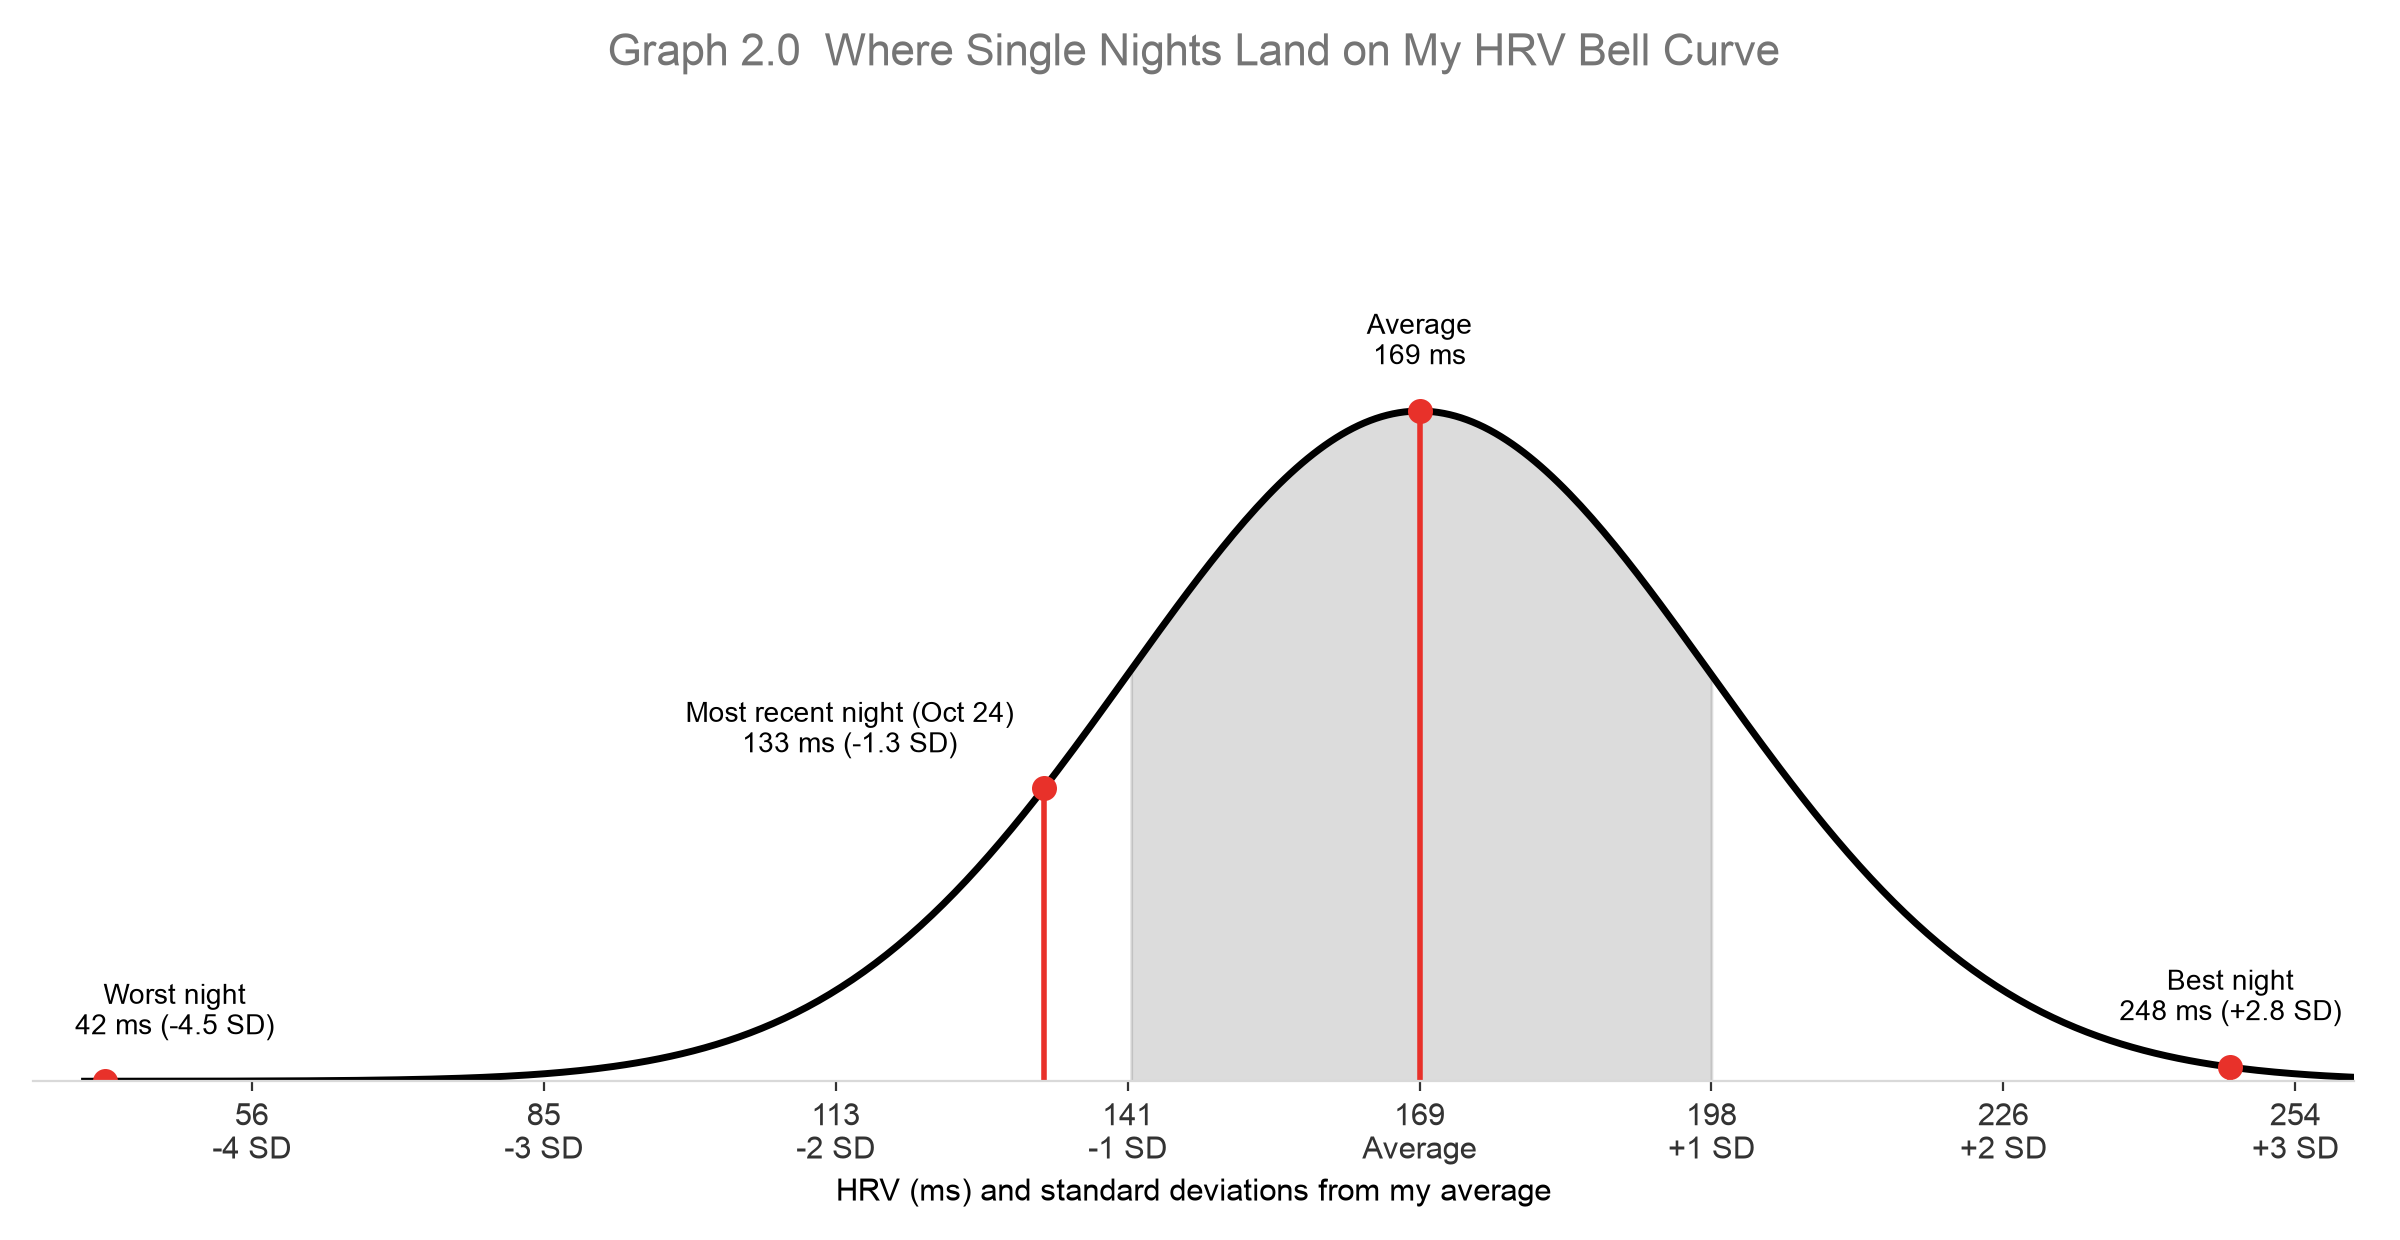
So a typical night for me sits somewhere between 141 ms and 198 ms (one standard deviation either side of the average). That's the grey band in Graph 2.0. If my standard deviation were 10 ms, the hill would be tall and narrow, meaning very consistent nights. If it were 50 ms, it would be flat and wide.
If you want to work these out yourself, it's the same two formulas from my Z-scores post: "=AVERAGE(B2:B1889)" and "=STDEV(B2:B1889)" in Google Sheets or Excel.
Where a single night lands
Once you know the average and the standard deviation, you can place any night on the curve. That's exactly what a Z-score is: (night's value - average) / standard deviation, or how many standard deviations a night sits from the middle.
| Night | HRV | Z-score | How to read it |
|---|---|---|---|
| Best nights (Aug 2023 and Jul 2024, tied) | 248 ms | +2.8 SD | Rare. Way out on the right edge. |
| Average | 169 ms | 0.0 SD | The top of the hill. |
| Most recent night (Oct 24, 2026) | 133 ms | -1.3 SD | Below normal, but not alarming. |
| Worst night (Jan 2026) | 42 ms | -4.5 SD | Extremely rare. Something was off. |
This is why I like thinking in standard deviations instead of raw numbers. "133 ms" doesn't mean much on its own. "1.3 standard deviations below my normal" tells me straight away that it was a below-average night, but well within what my body does from time to time.
My curve isn't perfect
Look at Graph 1.0 again and you'll notice the left side stretches further than the right:
- 50 nights fell more than 2 SD below my average, but only 28 fell more than 2 SD above it.
- 9 nights fell more than 3 SD below. None went 3 SD above.
In other words, my bad nights can be really bad, but my good nights have a ceiling. That makes sense: there's a limit to how recovered my body can get, but no real limit to how much a bad night (being sick, a long travel day, a big night out) can drag my HRV down.
My curve also hasn't stood still. My average HRV was 180 ms in 2023 in Vancouver and 160 ms in 2025 after moving to Querétaro, 1,820 m above sea level. One five-year curve blends those together. I'll split them apart in a later post.
That's what the George Box quote is about. No real data is a perfect bell curve, but my HRV is close enough that the bell-curve model is genuinely useful.
Takeaways
- A bell curve is what you get when most values cluster around the middle and get rarer the further out you go.
- Two numbers describe it: the average (where the middle is) and the standard deviation (how wide it is).
- A Z-score tells you where a single value lands on the curve, which is how you spot what's normal and what's an anomaly.
- Real data bends the rules. My HRV has a longer tail on the bad side, so it's worth plotting your data before you assume it's a perfect bell.
Next up, I'll test the most famous bell-curve rule of thumb, the 68-95-99.7 rule, against my own data and see which of my Whoop metrics actually follow it.