 Hari Jimenez · Oct 27, 2026 · 4 min read
The 68-95-99.7 Rule: Does My Body Follow It? Testing Five Years of Whoop Data
"In God we trust. All others must bring data." - W. Edwards Deming
In my last post I showed that five years of my heart rate variability (HRV) forms a near-perfect bell curve, and that you can describe any bell curve with two numbers: the average (where the middle is) and the standard deviation (how wide it is). This time I wanted to put a famous rule of thumb to the test: if my data really is a bell curve, can I predict how my nights will spread out?
Quick note: I'm not a health professional. This is one person's data, and Whoop scores aren't a diagnosis.
What the 68-95-99.7 rule says
If your data follows a bell curve, you can predict how much of it sits near the average:
| Distance from the average | Share of values the rule predicts | Out of my 1,888 nights |
|---|---|---|
| Within 1 standard deviation | 68% | about 1,290 nights |
| Within 2 standard deviations | 95% | about 1,795 nights |
| Within 3 standard deviations | 99.7% | all but about 5 nights |
That's it. It's also called the empirical rule, and it's the reason a Z-score (how many standard deviations a value is from the average, explained in my Z-scores post) is so easy to interpret. A Z-score of ±1 is common, ±2 happens about 1 time in 20, and ±3 should almost never happen.
HRV passes almost perfectly
My average HRV is 169 ms and my standard deviation is 28 ms. So the rule predicts that 68% of my nights land between 141 and 198 ms, 95% between 113 and 226 ms, and 99.7% between 85 and 254 ms. Here's what actually happened:
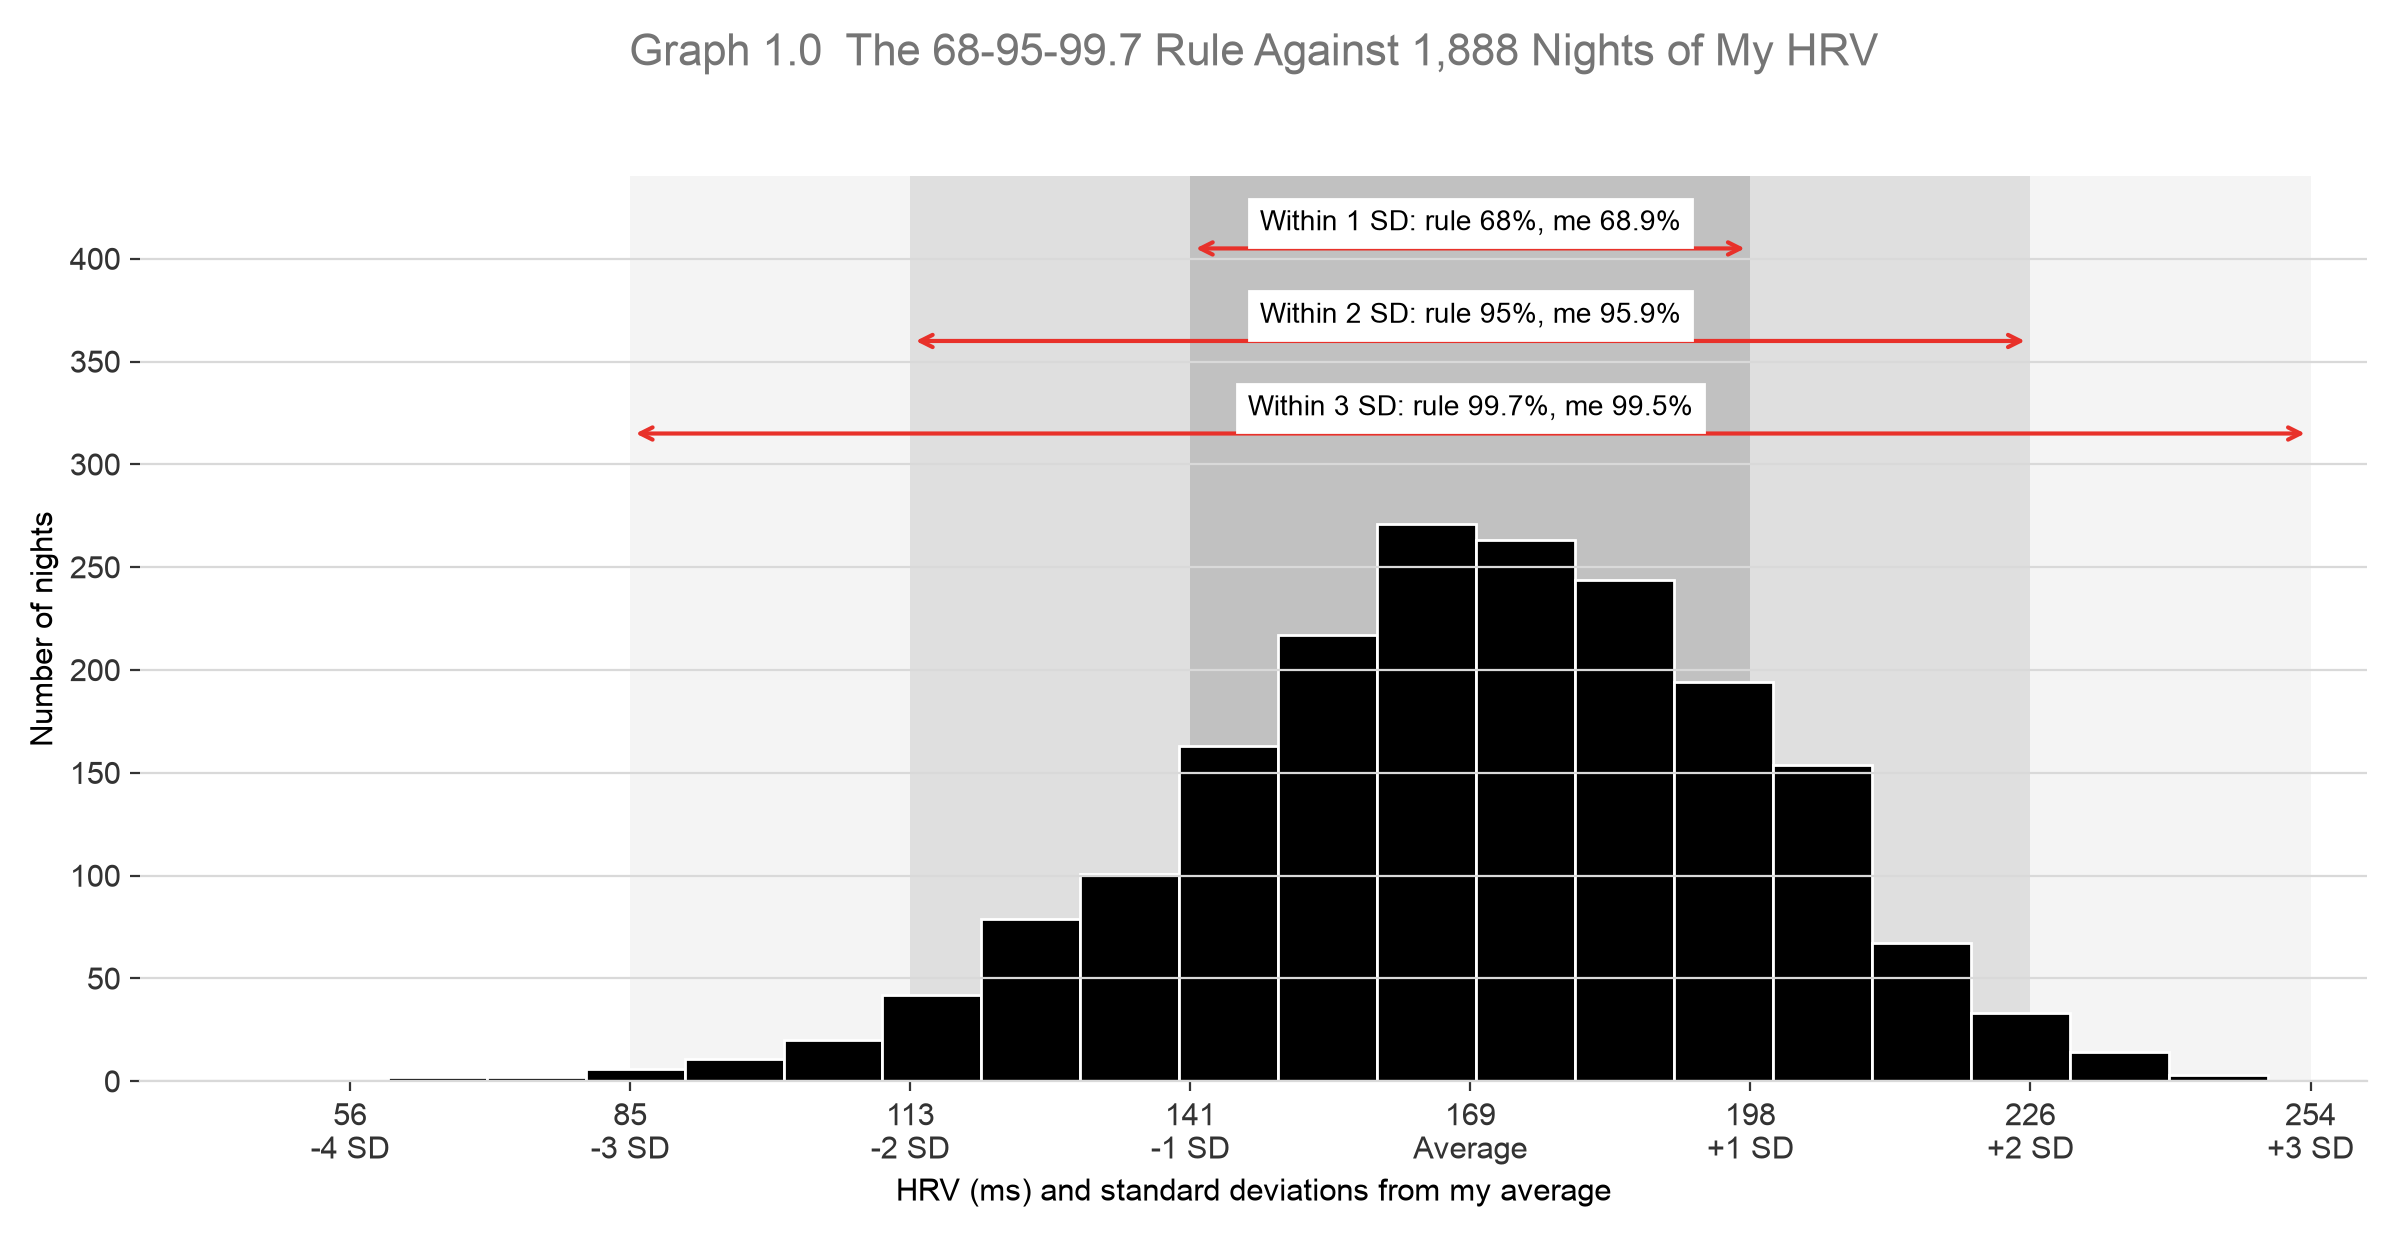
| Rule | My HRV | |
|---|---|---|
| Within 1 SD | 68% | 68.9% |
| Within 2 SD | 95% | 95.9% |
| Within 3 SD | 99.7% | 99.5% |
That's remarkably close for real-world data. The only miss is at the very edge: the rule expects about 5 nights beyond 3 SD and I had 9, all of them on the low side. As I covered last time, my bad nights can be really bad, but my good nights have a ceiling.
Which of my Whoop metrics follow the rule?
HRV is the star student, so I ran the same test on five more metrics. Graph 2.0 checks two things: the middle (does about 68% of my data sit within 1 SD?) and the extremes (do only about 5 nights land beyond 3 SD?).
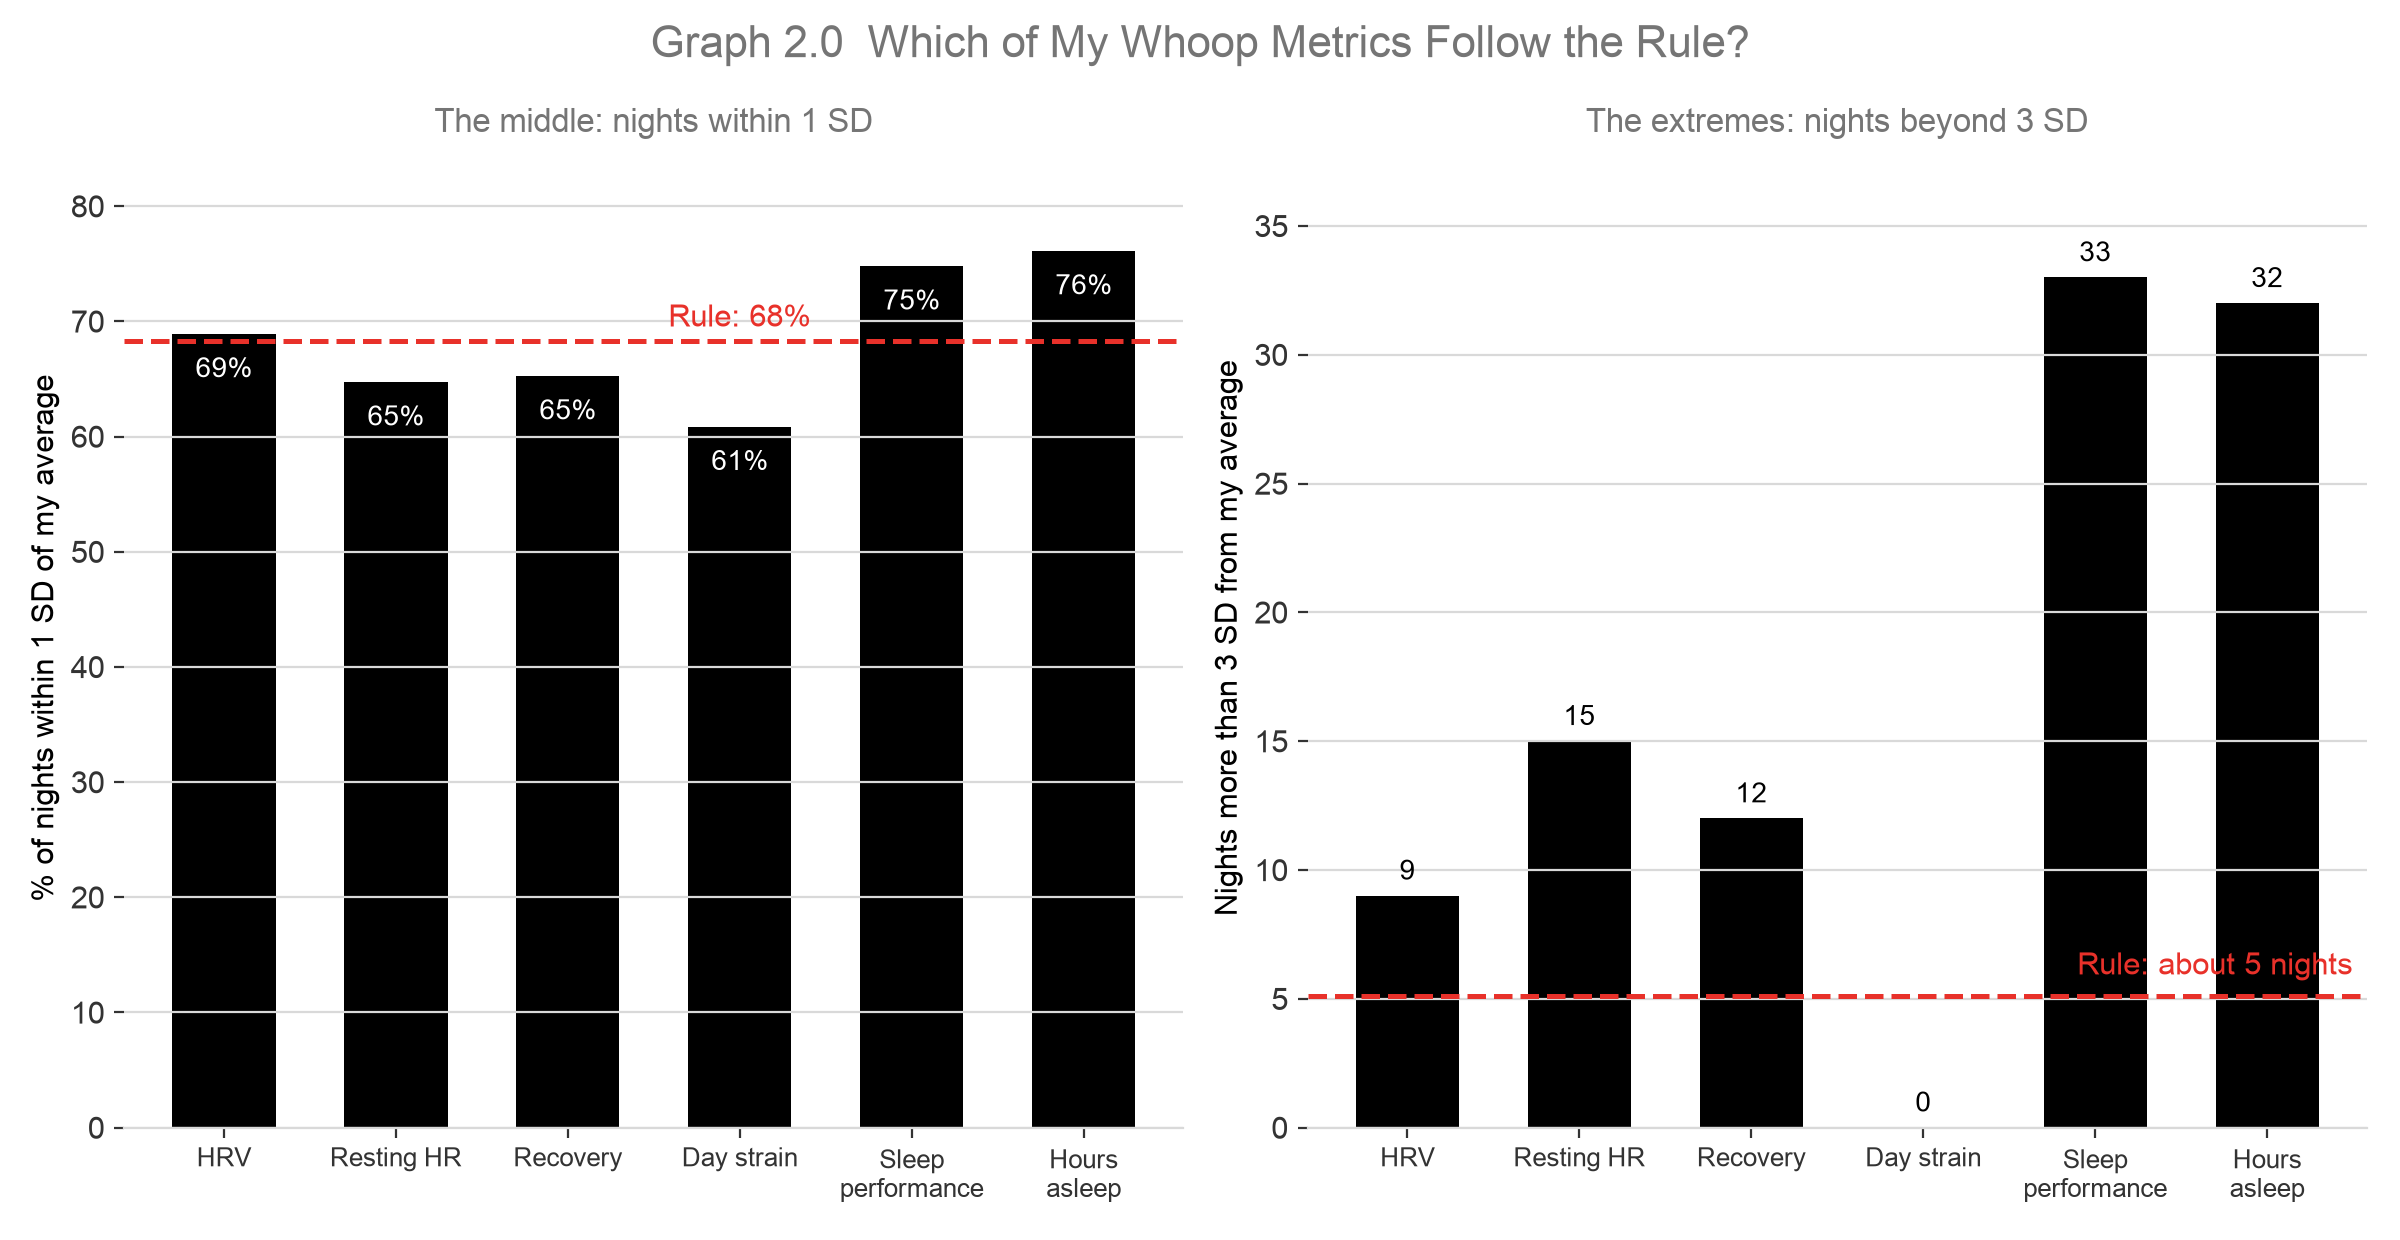
| Metric | 1 SD (68%) | 2 SD (95%) | 3 SD (99.7%) | Verdict |
|---|---|---|---|---|
| HRV | 68.9% | 95.9% | 99.5% | Passes |
| Resting heart rate | 64.7% | 96.0% | 99.2% | Close |
| Recovery | 65.3% | 97.0% | 99.4% | Close |
| Day strain | 60.9% | 99.8% | 100% | Fails |
| Sleep performance | 74.8% | 95.8% | 98.3% | Fails |
| Hours asleep | 76.1% | 94.9% | 98.3% | Fails |
- Resting heart rate is HRV's mirror image. All 15 of its extreme nights were on the high side, because the same bad nights that crash my HRV push my heart rate up.
- Recovery is close, but it's capped at 100%. Two standard deviations above my average would be 106%, which is impossible, so all of its extreme nights are on the low side.
- Sleep breaks the rule at both ends: too many nights bunched in the middle and six times more extreme nights than the rule allows (33 vs about 5). That one gets its own post next.
- Strain fails in the most interesting way, so let's look at it.
Strain is two hills, not one
Strain has too few days near the average (61% instead of 68%) and no extreme days at all. Graph 3.0 shows why.
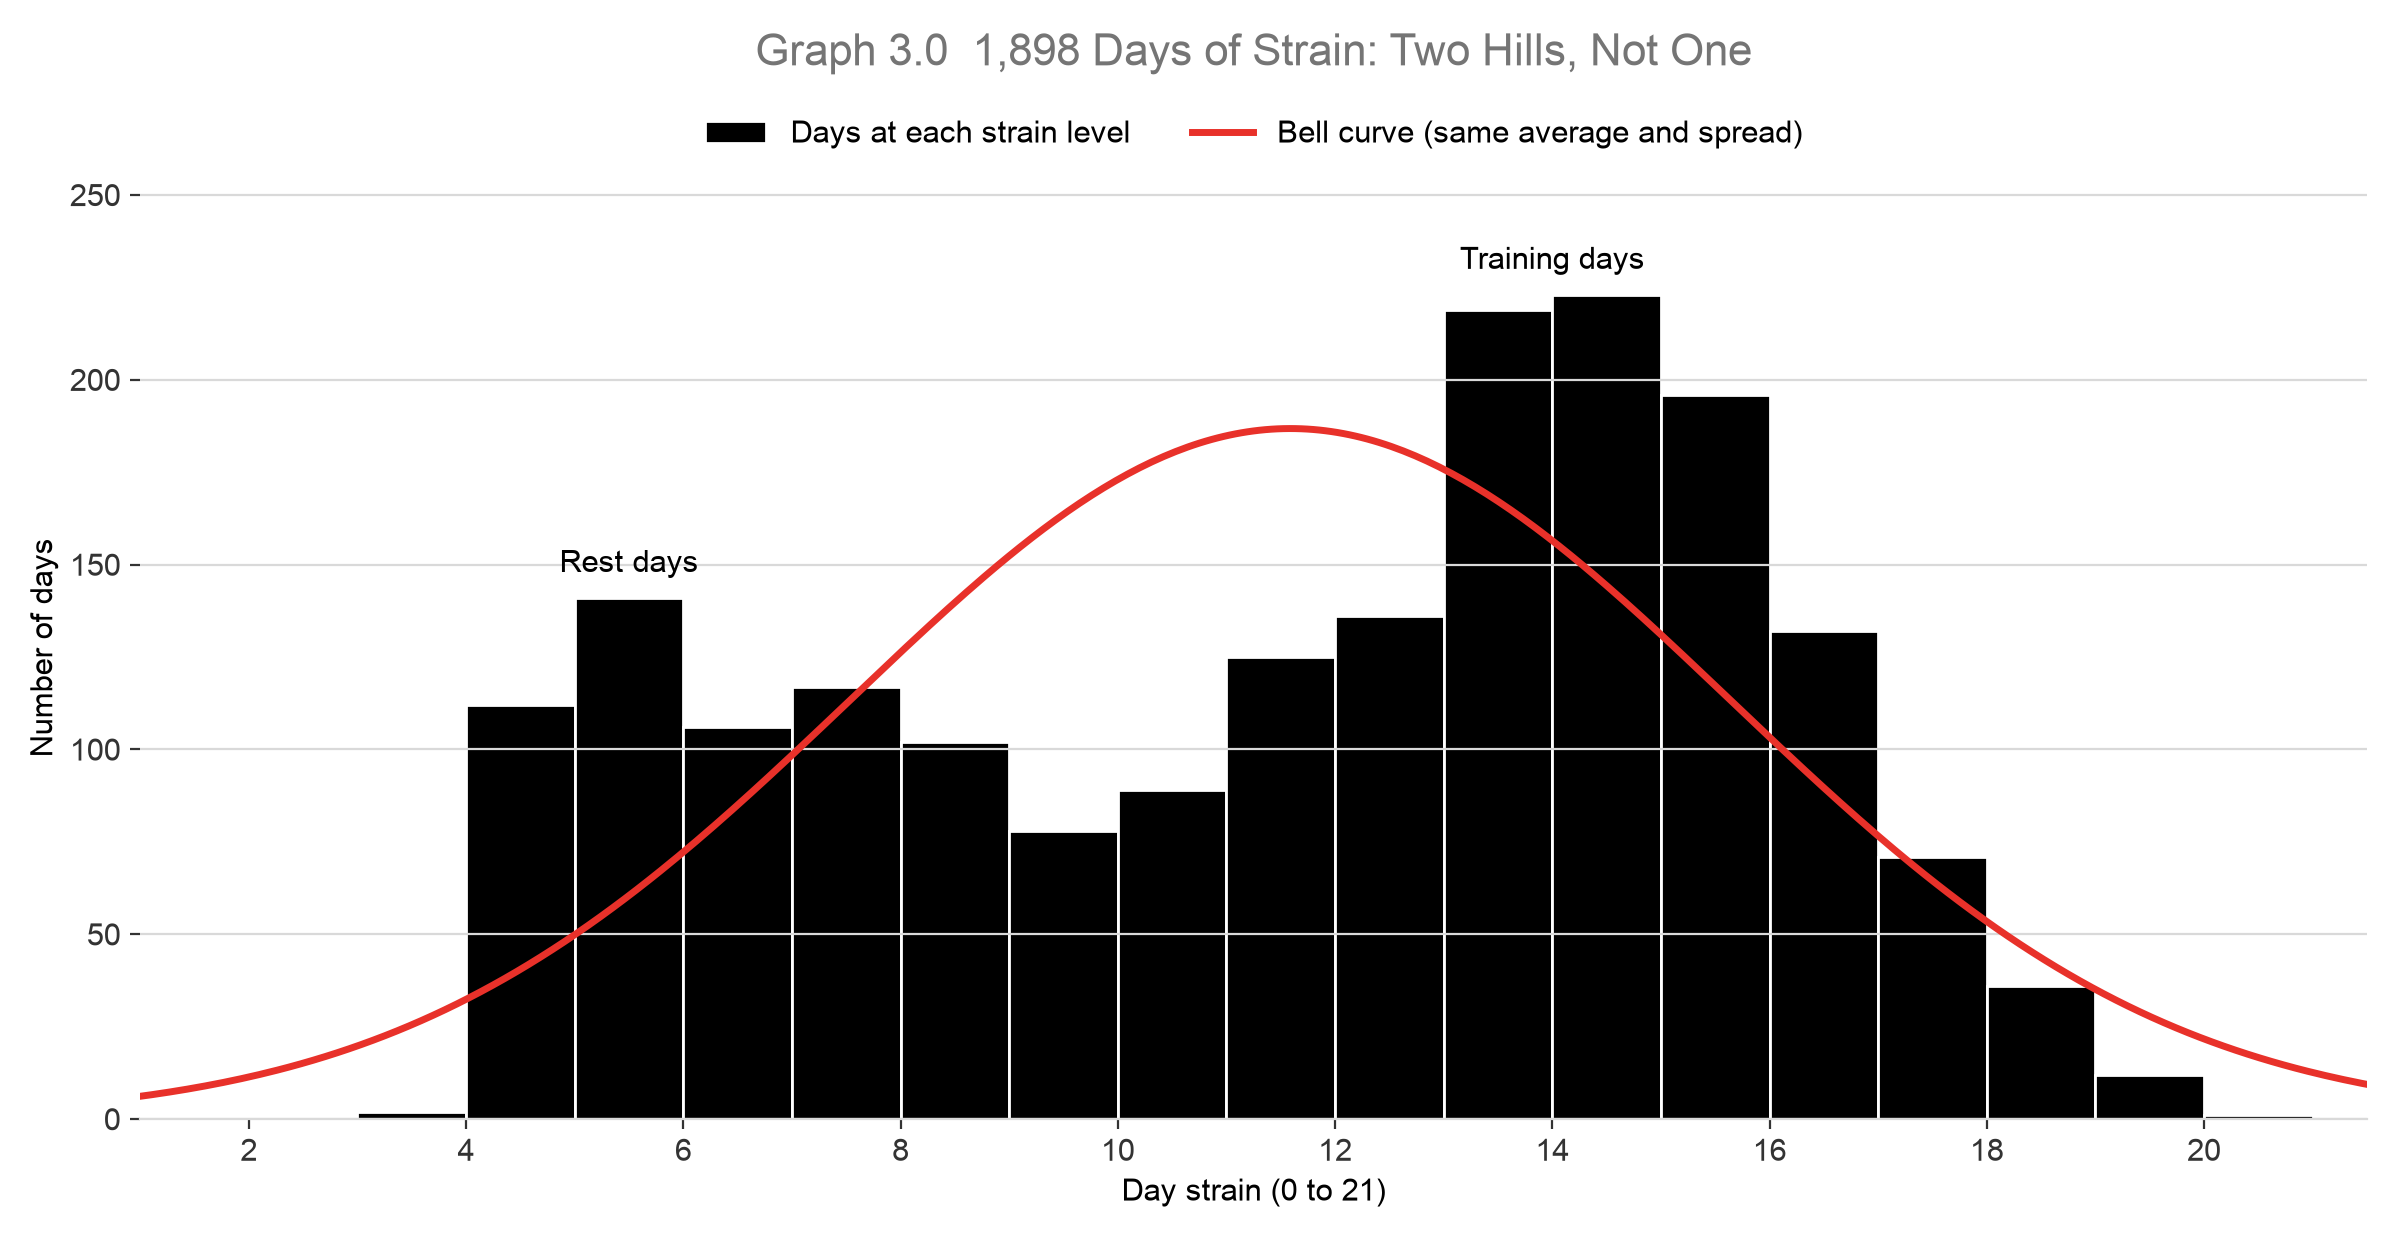
My strain isn't one bell curve, it's two:
- Rest days: no workout logged, average strain of 7.8.
- Training days: at least one workout, average strain of 14.1.
My overall average of 11.6 lands right in the valley between the two hills, which is a strain I rarely actually have. So the average describes almost none of my real days, and the rule falls apart. This is a mistake I see all the time in marketing too: averaging two different groups together (say, branded and non-branded search, or new and returning customers) and treating the result as if it described either one.
Takeaways
- The 68-95-99.7 rule says 68% of values sit within 1 standard deviation of the average, 95% within 2 and 99.7% within 3.
- It only works on bell curves. My HRV follows it almost perfectly. My sleep and strain don't.
- Check the extremes, not just the middle. Five of my six metrics looked fine within 2 SD, but four of them had more than twice as many extreme nights as the rule predicts (and over six times for sleep).
- Plot before you average. If your data has two hills, split it into two groups before you calculate anything.
If you use Z-scores on your own data (marketing, health or anything else), run this quick test first. If the rule holds, you can trust what a Z-score is telling you. If it doesn't, you'll know which numbers need a closer look.
Next up: why my sleep breaks the bell curve, and what that long tail of bad nights is made of.